Data Critique
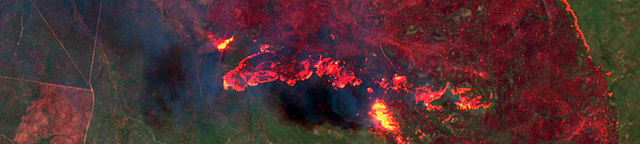
The dataset’s core data was generated through remote sensing technologies operated by NASA. Data acquisition occurred in near real time, from 2 satellite instruments. This dataset compiles both MODIS and VIIRS data for the six month period of peak fire activity from 2019-08-01 to 2020-01-11, providing a combined record of satellite fire detection over the Australian region. The original source of the datasets is the NASA Earthdata database, which includes all kinds of data from around the world collected by NASA’s many satellites. Specifically, the datasets we are using come from MODIS and VIIRS Active Fire Data. See this core dataset here.
The organization that helped create and fund the dataset is NASA. Specifically, the data usage and imagery is from LANCE firms that are operated by NASA’s Earth Science Data and Information System, and NASA Headquarters as a whole helped fund the research and creation of the dataset.
Our dataset includes the location of the fires represented by a column of latitude and a column of longitude. It also includes brightness, which is determined by the temperature of the fire as well as its oxygen supply, which could help to indicate how intense the fire is and what materials are being burned. Along with brightness, it also captures the size of fires using scan, which captures the amount of pixels in the West-East direction, and track, which captures the amount of pixels in the North-South direction. It includes the acquisition data in one column as well as the acquisition time in another. It includes the satellite that the data was captured from as well as the instrument in two different columns, which likely will not be necessary for our analysis. Lastly, our dataset includes confidence, which is the likelihood that the data collected coincides with the usual expected data.
This data can illustrate the locations, sizes, and intensities of fires using the columns provided. Using this information, the data can be used to see the effects of these fires on the land that they cover, allowing us to analyze the effects of the fires on communities in Australia. Things like brightness, scan, and track in combination with latitude and longitude allows us to see where fires were most intense. Using other sources looking into distribution of populations around Australia, we can make reliable conclusions on the effects of the bushfires on various urban and rural areas in Australia.
Our dataset focuses mainly on the physical aspects of the fire such as location, time, and strength of the fire. The dataset does not contain information specifying the effects of the fires. It also lacks information regarding the causes of each fire. Information about the populations of the spaces the fires occupied are also not present. Because of these absences in data, we need to access other sources in order to analyze the effects of the fire on the general population of Australia. We would need to research the general distribution of communities throughout Australia so that we could conclude the effects the fires had on these communities. From this dataset we are able to get a basic understanding of where these fires are happening, but in order to understand the broader effects of these fires we need to access other sources as well.
If the dataset was our only source, it would only look into purely physical or scientific spreading of the fires. It does not talk about the narratives or any of the human and environmental effects caused by these fires. For example, it does not mention anything about affected communities, loss of biodiversity, or the damage it did in an economic or environmental setting. Other research would be necessary in order to form a reasonable data analysis on the effects of the Australian bushfires on the various communities of Australia, but the information provided gives us a great starting point to further analyze and form a narrative.